Direxion Daily Financial Bull 3X Sh.. (FAS)
Exchange: USA Stocks • Country: USA • Currency: USD • Type: Etf • ISIN: US25459Y6941 • Trading--Leveraged Equity
The Direxion Daily Financial Bull 3X Shares (NYSE ARCA:FAS) is an investment fund that aims to provide triple the daily performance of a specific financial index. To achieve this, the fund invests at least 80% of its assets in a mix of financial instruments, including swap agreements, securities, and ETFs that track the index.
The index itself focuses on companies from various financial industries, including banks, thrifts, mortgage finance, diversified financial services, consumer finance, capital markets, insurance, and mortgage real estate investment trusts (REITs). This means the fund is exposed to a broad range of financial sectors, giving investors a diversified portfolio within the financial sector.
It's worth noting that the fund is non-diversified, which means it can invest a larger portion of its assets in a smaller number of securities. This can increase the fund's potential returns, but also increases the risk.
The fund is managed by Direxion, a US-based investment management company. You can find more information about the fund and its investment strategy on the Direxion website.
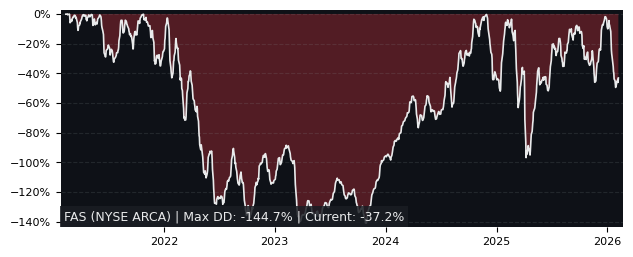
Drawdown (Underwater) Chart
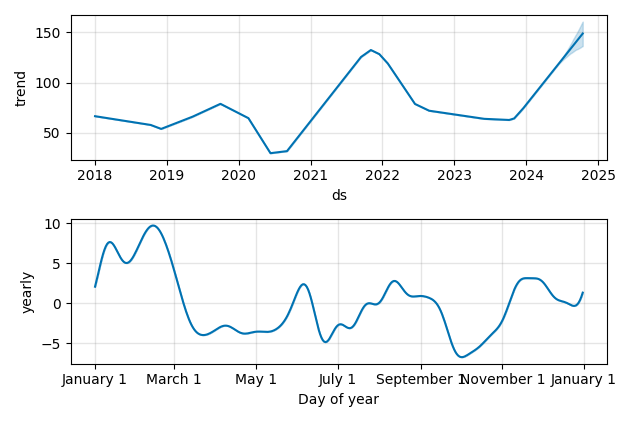
Overall Trend and Yearly Seasonality
FAS ETF Overview
| Market Cap in USD | 2,155m |
| Category | Trading--Leveraged Equity |
| TER | 0.94% |
| IPO / Inception | 2008-11-06 |
FAS ETF Ratings
| Growth 5y | 3.28 |
| Fundamental | - |
| Dividend | 5.65 |
| Rel. Performance vs Sector | 4.20 |
| Analysts | - |
| Fair Price Momentum | 108.62 USD |
| Fair Price DCF | - |
FAS Dividends
| Yield 12m | 1.48% |
| Yield on Cost 5y | 2.58% |
| Dividends CAGR 5y | 20.24% |
| Payout Consistency | 51.0% |
FAS Growth Ratios
| Growth 12m | 96.12% |
| Growth Correlation 12m | 66% |
| Growth Correlation 3m | 26% |
| CAGR 5y | 11.79% |
| CAGR/Mean DD 5y | 0.33 |
| Sharpe Ratio 12m | 2.52 |
| Alpha vs SP500 12m | 13.28 |
| Beta vs SP500 5y weekly | 3.36 |
| ValueRay RSI | 86.10 |
| Volatility GJR Garch 1y | 31.19% |
| Price / SMA 50 | 8.32% |
| Price / SMA 200 | 39.79% |
| Current Volume | 374.2k |
| Average Volume 20d | 400.2k |
External Links for FAS ETF
Wall Street Journal • Benzinga • Yahoo Finance
Tweets
X • Stocktwits
Fund Manager Positions
Dataroma • Stockcircle
As of May 19, 2024, the stock is trading at USD 112.32 with a total of 374,182 shares traded.
Over the past week, the price has changed by +4.06%, over one month by +20.50%, over three months by +19.23% and over the past year by +97.71%.
According to ValueRays Forecast Model, FAS Direxion Daily Financial Bull 3X Sh.. will be worth about 128.3 in May 2025. The stock is currently trading at 112.32. This means that the stock has a potential upside of +14.22%.
| Issuer | Forecast | Upside |
|---|---|---|
| Wallstreet Target Price | - | - |
| Analysts Target Price | - | - |
| ValueRay Target Price | 128.3 | 14.2 |