Tronox Holdings PLC (TROX) - Stock Price & Dividends
Exchange: USA Stocks • Country: United States • Currency: USD • Type: Common Stock • ISIN: GB00BJT16S69
Tronox Holdings PLC, listed on the NYSE as TROX, is a leading company known for its extensive range of products. The company operates as a vertically integrated manufacturer of TiO2 pigment, catering to regions that include North America, South and Central America, Europe, the Middle East, Africa, and the Asia Pacific.
Tronox Holdings PLC goes beyond just manufacturing pigment. They are also involved in various operations such as mining titanium-bearing mineral sand, as well as beneficiation and smelting activities. Their diverse product line includes TiO2 pigment, ultrafine specialty TiO2, zircon, feedstock, pig iron, monazite, titanium tetrachloride, and more.
The products offered by Tronox Holdings PLC have widespread applications, including use in paints, coatings, plastics, and paper. Additionally, their products find utility in various other industries. The company, headquartered in Stamford, Connecticut, is recognized for its quality products and global presence.
For more information about Tronox Holdings PLC, you can visit their official website at https://www.tronox.com.
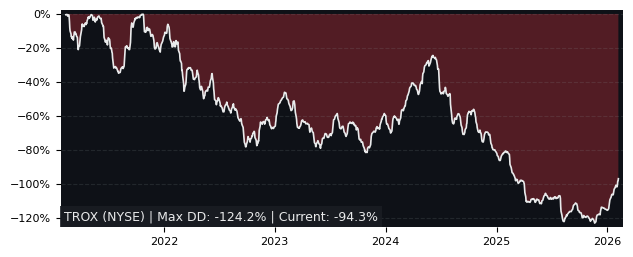
Drawdown (Underwater) Chart
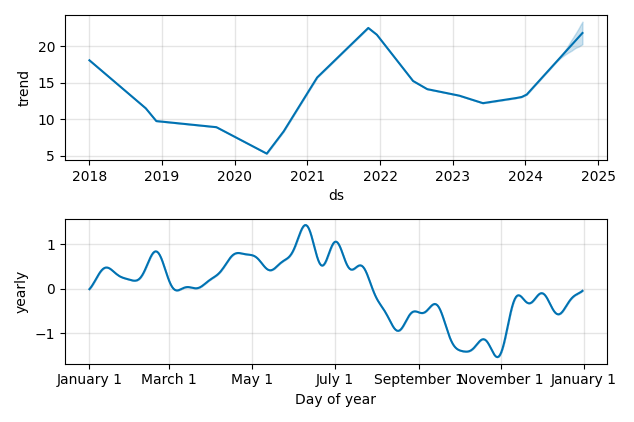
Overall Trend and Yearly Seasonality
TROX Stock Overview
| Market Cap in USD | 2,573m |
| Sector | Basic Materials |
| Industry | Chemicals |
| GiC SubIndustry | Commodity Chemicals |
| TER | 0.00% |
| IPO / Inception | 2005-11-22 |
TROX Stock Ratings
| Growth 5y | 3.50 |
| Fundamental | -29.5 |
| Dividend | 8.03 |
| Rel. Performance vs Sector | 2.51 |
| Analysts | 3.88/5 |
| Fair Price Momentum | 18.53 USD |
| Fair Price DCF | - |
TROX Dividends
| Yield 12m | 2.65% |
| Yield on Cost 5y | 4.52% |
| Dividends CAGR 5y | 22.67% |
| Payout Consistency | 89.7% |
TROX Growth Ratios
| Growth 12m | 53.98% |
| Growth Correlation 12m | 52% |
| Growth Correlation 3m | 67% |
| CAGR 5y | 11.23% |
| Sharpe Ratio 12m | 1.07 |
| Alpha vs SP500 12m | 15.04 |
| Beta vs SP500 5y weekly | 1.65 |
| ValueRay RSI | 94.14 |
| Volatility GJR Garch 1y | 43.08% |
| Price / SMA 50 | 13.97% |
| Price / SMA 200 | 37.72% |
| Current Volume | 1566.8k |
| Average Volume 20d | 1132.8k |
External Links for TROX Stock
Wall Street Journal • Benzinga • Yahoo Finance
Tweets
X (Twitter) • Stocktwits
Fund Manager Positions
Dataroma • Stockcircle
As of May 04, 2024, the stock is trading at USD 18.84 with a total of 1,566,765 shares traded.
Over the past week, the price has changed by +7.78%, over one month by +9.47%, over three months by +35.73% and over the past year by +49.75%.
According to ValueRays Forecast Model, TROX Tronox Holdings PLC will be worth about 20.2 in May 2025. The stock is currently trading at 18.84. This means that the stock has a potential upside of +7.38%.
| Issuer | Forecast | Upside |
|---|---|---|
| Wallstreet Target Price | 18.6 | -1.11 |
| Analysts Target Price | 16 | -15.1 |
| ValueRay Target Price | 20.2 | 7.38 |